Francis Galton
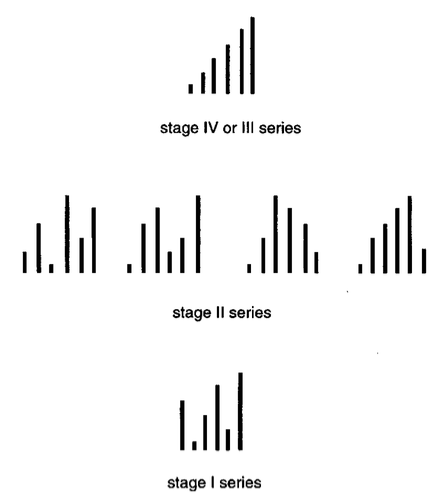
“…this peculiarity is found so far as my observations have extended, in about 1 out of every 30 adult males or 15 females. It consists in the sudden and automatic appearance of a vivid and invariable “Form” in the mental field of view, whenever a numeral is thought of, and in which each numeral has its own definitive place. This Form may consist of a mere line of any shape, of a peculiarly arranged row or rows of figures, or of a shaded space.” (Galton 1880)

 The term numeral is now more usually used to refer to the digits of a say base 10 number system, with numerals 0 1 2 3 4 5 6 7 8 9. In modern parlance the visualisations above are therefore of numbers rather than numerals. They also seem to be surprisingly biased towards representing the verbal -ty number words, twenty, thirty etc. (B, S1, H also -teen word numbers, thirteen, fourteen etc. R, EN, NL, RN and ED) see earlier post about verbal number words.
Colour and brightness play a part in some representations (C, GE, GS, EN, MT, TEW) and lines shown in the diagrams sometimes do not appear in the actual mental representation (WHP, MT). The number 12 also seems to be well represented (B, WS, C, GS,MT, GH, THW, PGE, LMH, NL, RN,CH) probably because of its importance in clock counting. There is also a left-to-right and / or bottom-to-top preference in representing increasingly large numbers, but this is by no means universal.
In summary this effect is automatic and involuntary, located in a fixed internal visual space, is idiosyncratic, emerges in childhood, is stable over time but is far from universal. Because of this the effect is usually thought to be a specific form of synesthesia. (Hubbard et al 2005)
SNARC Effect
The Spatio-Numerical Association of Response Codes (or SNARC) effect refers to the fact that when subjects, doing some task, are presented with Arabic numbers in the range 1-9, they respond more quickly to small numbers (1-4) with the left hand and more quickly to large numbers (6-9) with the right hand. (Dehaene et al 1993)
According to Dehaene and his associates, the effect works for single (experiment 1) or two digit numbers (experiment 2) and is not affected by the subjects being left or right handed (experiment 5) or crossing hands (experiment 6) but is reduced for subjects with a right-to-left reading habit (experiment 7). It is absent for letters (experiment 4) but present for number words (experiments 8 and 9).
The effect seems to be a relative one, because when the presented number range is limited to the numbers 1 to 5, people respond more quickly with the right hand to the numbers 4 and 5, the right-hand end of the putative number line. But when the range presented is 4 to 9 people respond more quickly with the left hand to the same numbers 4 and 5, that have now become the left-hand end of the number line.
From these experiments Dehaene and his collaborators suggested that:-
“…the representation of number magnitude is automatically accessed during parity judgment of Arabic digits. This representation may be linked to a mental number line […], because it bears a natural and seemingly irrepressible correspondence with the natural left – right coordinates of external space.”
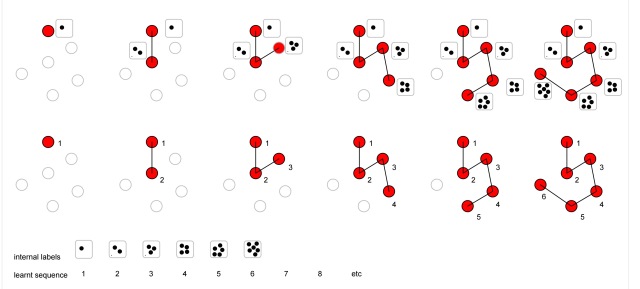
As with subitising the response is automatic but learnt, see Subitising.
But unlike subitising which is identifiable in children as young as 3 months old, the SNARC effect only appears in children’s responses when they are at least 7 years or by some accounts 9 years old.
The task in Dehaene’s two digit experiment (experiment 2) was a parity (odd or even) judgement and it has been pointed out that the parity of 2 digit numbers can be assessed entirely from the last digit, so there is some doubt that the effect extends to two digit numbers.
The effect is also observed with eye movement, responses by looking to the left being faster when recognising small numbers and faster to the right with large numbers.
A similar effect occurs when people are asked to generate numerals randomly. If their head is turned to the left they tend to generate more lower numbers and more higher numbers when their head is turned to the right.
It has also been observed that when the distance between thumb and forefinger is varied; the greater the distance being held the more likely a random numeral is to be larger than expected. (Andres et al. 2004)
Priming
The SNARC effect requires no conscious effort and in fact takes place entirely unconsciously a fact that is emphasised by the fact that a priming effect has also been observed. So if a numeral is displayed that is unrelated to the task being undertaken, then the numeral displayed can affect whether the right or left hand is used preferentially.
Most authors assume that the parity (odd or even) judgement, used in most of the reported experiments, is just such a task; but the subjects are making a judgment about the displayed number and therefore paying attention to it. I think to demonstrate a true priming effect the task being carried out should not draw attention to the displayed numeral or use it in any way.
Reading Direction
The effect also seems to be related to the cultural background of subjects, particularly their habitual reading direction. The graph below shows the difference between right-hand and left-hand reaction times for a group of Canadian students with left-to-right reading habits and displays a normal SNARC effect.
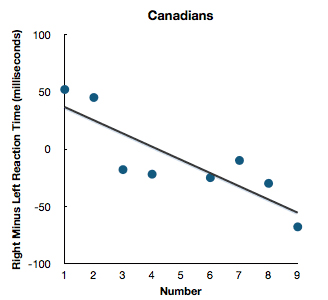
After Shaki S., Fischer M., & Petrusic W. (2009)
However, monolingual Arabic speaking Palestinians who are therefore right-to-left readers exhibit an inverse SNARC effect.
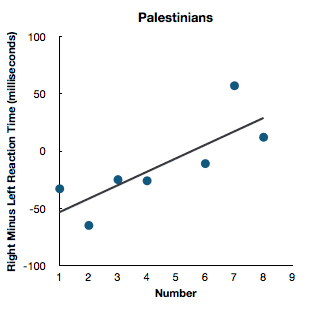
After Shaki S., Fischer M., & Petrusic W. (2009)
And the effect almost disappears with monolingual Hebrew speaking Israelis, who read text from right-to-left but read Arabic numbers from left-to-right, .
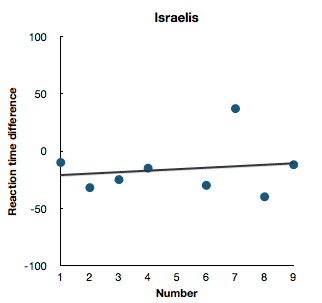
After Shaki S., Fischer M., & Petrusic W. (2009)
This shows that the SNARC effect is susceptible to habitual reading direction, but there is also evidence that it is an effect that is fairly easy to un-train. For instance if subjects are asked to think about numbers as if they are on a clock face, where the numbers increase in an approximate right-to-left direction, then the effect is not observed. (Bächtold et al 1998)
Incidentally, the graphs above all display a particular cultural preference, which might be relevant to the SNARC effect itself. The abscissa (x axis) is shown with values that increase from left to right. And the secondary ordinates (y axis) show values that increase from bottom to top, exhibiting the lower-to-higher small-to-large number metaphor.
Finger Counting
Apparently in all human cultures children use finger counting before being taught arithmetic. (Butterworth 1999)

In a study of Scottish students, 83% right-handed, 10% left-handed and 7% ambidextrous, 66% started finger counting on their left hand (left starters) and 34% on their right hand (right starters), a significant difference. Of the left starters 92% started counting on the thumb, 3% on the index finger and 4% on the pinkie or little finger. With the right starters 80% started counting on the thumb. So in total 61% (92% of 66%) are left starters who start to count with the left hand thumb and exhibit the counting pattern illustrated above, that is a pattern that corresponds to a left-to-right number line representation. (Fischer 2008) Fischer himself suggests that there are studies that disagree with these findings. (Satoa and Lalaina 2008)
I think there may be some problems with the survey method used to collect this data; in particular the fact that the questionnaire included the diagram above (without the added numerals) showing the hands palm-up, perhaps unconsciously suggesting to respondents a left-right number line.
Statistically right starters have a small and significantly weaker SNARC effect than left starters who have a normal SNARC effect. This at least indicates that that finger counting habits exert an influence on numerical cognition. See also Five Finger Exercises
Sex Difference
It is reported that the SNARC effect is weaker in females than in males as shown in the graph below. (Bull, Cleland and Mitchell 2013) It is hypothesised that this may be due to the fact that the inferior parietal lobe, identified by fMRI studies as being involved in numerical cognition, is 25% bigger in men than in women, or in jest that men have a greater arm span than women.
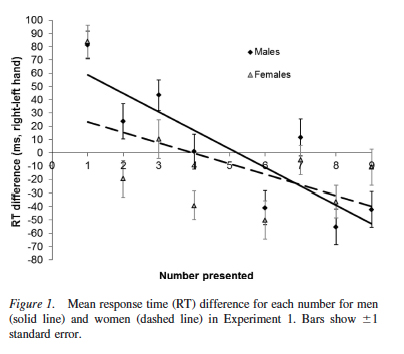
from Bull, Cleland and Mitchell 2013
Button Labels
Interesting things start to happen if labels “left” and “right” are put on the left-hand and right-hand buttons (congruently) or in Stroop like fashion put on the wrong buttons (incongruently). The arrangements are shown in the physical account on the right hand side of the diagram below, where the expected preference for the centrally displayed target number is indicated by the bold buttons. (van Dijck & Fias 2011)

After van Dijck & Fias (2011)
With a size comparison task and instructions if the target number is less than 5 press the button labelled “left” and if the target number is greater than 5 press the button labelled “right” or vice-versa, the following results are obtained.

After van Dijck & Fias (2011)
The authors believe that subjects are responding to the conceptual account on the right in the table above, where the incongruent preferences are reversed. They suggest that the SNARC effect derives from congruency between conceptual categories and not from congruency between a position on a mental line and left to right responses. They also suggest that the conceptual account listed above, maps to a more general set of left-to-right categories such as:-

After Proctor & Cho 2006
This has lead some observers to believe that the SNARC effect is as much a verbal phenomena as a numerical one.
Discussion
All authors seem to agree that numbers are at least to some extent represented spatially and that the SNARC effect is in some way a real effect.
Sequence-space synaesthetes, like Galton’s subjects, do not appear to have unusually strong SNARC responses, probably indicating that they are using a separate mental mechanism.
The SNARC effect is essentially statistical, that is not experienced by everyone or experienced in varying degrees by others. For instance cultural differences, the weaker effect in the 34% of right starting finger counters and the weaker effect in women.
There is an emerging tendency to see the SNARC effect as a verbal rather than a specifically numerical effect.
The embodied cognition paradigm suggests that all of our knowledge is represented together with the sensory and motor activity that was present during its acquisition. So it should be expected that an abstract ability such as numerical cognition inherits the functional properties of more basic perceptual and motor process such as subitisation, finger counting, number lines and other relational metaphors. (Lakoff & Núñez 2000)
Speculation
It would be good to see if the SNARC effect could be used to prime some desired action such as a preferential turn to the left if a small number is displayed in the field of vision or to the right if a large number is displayed. But first it would be necessary to establish that a true priming effect can be established. That is to have the display of small or large numbers influence peoples’ actions without attention having been drawn to the displayed number.
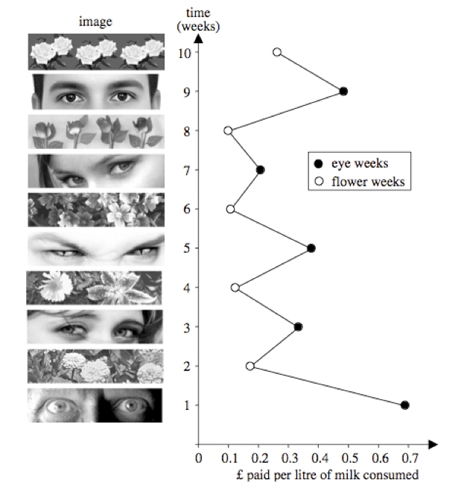
For instance the famous effect of having a poster with eyes rather than flowers over a British university staff common room honesty box increasing the amount of money being put into the box. (Kaheman 2011) (Bateman, Nettles and Roberts 2006)
If such a priming effect could be demonstrated for numbers, then it would be fairly simple to build a maze like computer game which users could walk through and only have to decide to turn left or right at each T junction where a randomly selected number was displayed. A game that could obviously be instrumented to automatically collect data on the effect.
Finally it would be interesting to see if the SNARC effect could be exported into the real world, for instance 7 George Square, which from this position has symmetrical left and right stairways leading into the building.

Bibliography
Andres, M. , Davare, M. , Pesenti, M. , Olivier, E. & Seron, X. (2004) Number magnitude and grip aperture interaction. Neuroreport 15, 2773–2777 .
Bächtold D, Baumüller M, Brugger P. (1998) Stimulus-response compatibility in representational space Neuropsychologia 36(8):731-5
Bateson M., Nettle, D., Roberts, G. (2006) Cues of Being Watched Enhance Cooperation in a Real World Setting Biology Letters 2 412‐14
Bull, R., Cleland, A.A., & Mitchell, T. (2013) Sex Differences in the Spatial Representation of Number Journal of Experimental Psychology: General 142(1) 181-192
Butterworth B. (1999) The Mathematical Brain Macmillan, London
Dehaene, S., Bossini, S., & Giraux, P. (1993). The mental representation of parity and number magnitude. Journal of Experimental Psychology: General 122: 371-396.
van Dijck J. P. & Fias W. (2011) A working memory account for spatial-numerical associations Cognition 119(1) 114-119
Fischer M. H. (2008) Finger counting habits modulate spatial-numerical associations cortex 44 386-392
Fischer M. H. (2011) The spatial mapping of numbers – its origin and flexibility in Language and Action in Cognitive Neurosciences, eds Coello Y., Bartolo A., editors. London, Psychology Press
Fischer M. H., Castel A. D., Dodd M. D., & Pratt J. (2003). Perceiving numbers causes spatial shifts of attention. Nature Neuroscience, 6, 555–556.
Galton F. (1880) Visualised Numerals Nature Vol. 21 252-6, 494-5
Galton, F. (1881) The Visions of Sane Persons Popular Science Monthly Volume 19 August 1881
Hubbard E. M, Manuela Piazza, M., Pinel, P. & Dehaene, S. (2005) Interactions between number and space in parietal cortex Nature Reviews Neuroscience 6, 435-448 (June 2005)
Kahneman D. (2011) Thinking Fast, Thinking Slow. Allen Lane. p 57
Lakoff G. & Núñez R. E. (2000) Where Mathematics Comes From: How the Embodied Mind Brings Mathematics into Being Basic Books
Proctor R. W. & Cho Y. S. (2006) Polarity correspondence: A general principle for performance at speeded binary classification tasks. Psychological Bulletin 132(3) 416-442
Satoa M. and Lalaina M. (2008) On the relationship between handedness and hand-digit mapping in finger counting cortex 44 393-399
Shaki S., Fischer M., & Petrusic W. (2009). Reading habits for both words and numbers contribute to the SNARC effect Psychonomic Bulletin & Review, 16 (2), 328-331
Wood G., Nuerk H. C., Willmes K., Fischer M. H. (2008). On the cognitive link between space and number: a meta-analysis of the SNARC effect. Psychol. Sci. Q. 50, 489–525.
Zebian S. (2005) Linkages between number concepts, spatial thinking and directionality of writing: The SNARC effect and the reverse SNARC effect in English and Arabic monliterates, biliterates and illiterate Arabic speakers. Journal of Cognition and Culture 8(1–2) 165-190