
In 1871 the early economist and logician William Stanley Jevons published an article in Nature “The Power of Numerical Discrimination” (Jevons 1871)
According to Jevons, Sir William Hamilton had clearly stated the problem:
“Assuming that the mind is not limited to the simultaneous consideration of a single object, a question arises, How many objects can it embrace at once? ……
If you throw a handful of marbles on the floor, you will find it difficult to view at once more than six, or seven at most, without confusion; but if you group them into twos, or threes, or fives , you can comprehend as many groups as units, because the mind considers these groups as units; views them as wholes, and throws their parts out of consideration.”
Using a simple experimental technique, Jevons set out to answer Sir William Hamilton’s question.
“A round paper box 4 1/2″ in diameter, lined with white paper and with the edges cut down to be only 1/4″ high, was placed in the middle of a black tray. A quantity of uniform black beans was then obtained, and a number of them taken up casually were thrown towards the box so that a wholly uncertain number fell into it. At the very moment when the beads came to rest, their number was estimated without the least hesitation, and then recorded together with the real number obtained by deliberate counting”
The data Jevons collected this way is tabulated below (taken directly from his article).
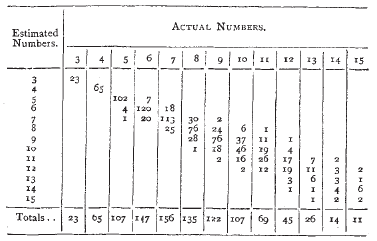
The table gives the number of times each set size was estimated correctly or incorrectly. So six beans were correctly identified 120 times but were incorrectly identified as five beans 7 times and as seven beans 20 times. Jevons was not surprised that he never made a mistake with three and four beans but was surprised that in 5% of trials he made mistakes with five beans.
Jevons analysed the error rates as follows:-
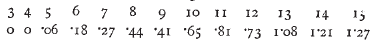
He supposed the error rate proportional to the excess of the real number over 4½ and obeying the formula error = m x (n – 4½) where n is the correct number and m is some constant. He than calculated m for each of the values of n :-
![]()
Seeing them sufficiently equal he took the average (0.116) and proposed the following empirical formula:-
error = 0.116 x (n – 4½) or approximately n / 9 – ½
Discussion
Jevons concluded that for him the absolute limit of discrimination was 4, but recognised that the limit probably varied for other people and might perhaps be taken as 4½ if that made any sense.
His estimate corresponds fairly accurately to modern estimates of the subitising range for randomly located dots. See Subitising.
The data also corresponds to Weber’s Law with accuracy getting worse as set size increases. A post on Weber’s Law to follow.
The diagram below summarises the error data.
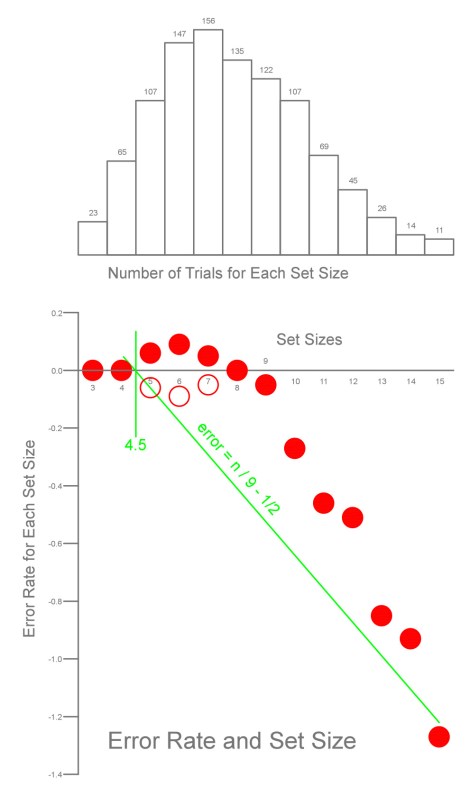
Jevons calculated his formula using unsigned error values (red outlines above) rather than signed errors (solid red above).
He also recognised that his method of throwing beans lead to the skewed distribution shown above with many more sets of seven beads thrown (156) than sets of three (23) or fifteen (11). Something that could easily be avoided using modern presentation techniques. See Find Your Own Space.
Bibliography
Jevons, W.S., (1871) The Power of Numerical Discrimination Nature, Thursday February 9, 1871.
