The co-inventor of the bar code N. J0seph Woodland died recently; his other co-inventor, Bernard Silver, having already died in 1963 aged just 38. They had been inspired by Silver overhearing the president of a food chain pleading with one of the deans of Drexel Institute of Technology to undertake research on capturing product information automatically at the checkout and the dean turning the request down.
http://www.guardian.co.uk/technology/2012/dec/16/n-joseph-woodland
Their patent was filed in 1949 and accepted in 1951, it included a means of optically reading the codes by moving the target and the reading device relative to each other.
Creation Myth
In 2004 Woodlands remembered how the idea came to him having learnt Morse Code as a Boy Scout: “I was sitting in a beach chair. I stuck my fingers in the sand, and I drew my hand to me. I left three or four furrows in the sand. I said, ‘Wow. I could have wide lines and narrow lines [instead of dots and dashes].’ That was the invention. It sounds too simple, doesn’t it?”.
Coding
FIG 1 above shows a pattern of white lines numbered 1-4 on a black background 5. Line 1 is a datum line and lines 2, 3 and 4 are in fixed positions with respect to it. There are then fixed places for lines 2, 3 and 4 in the pattern and these are termed information lines. While lines 2, 3 and 4 have fixed places, these places do not need to be filled; for instance, in FIG 3 line 4 is missing. A zero (0) is associated with missing lines and the number 1 (1) with occupied lines. The information pattern in FIG 3 could therefore be replaced by the code number 110 and the pattern of FIG 4 by 101. These codes can be interpreted as binary codes as follows line where line 4 -> 20 = 1, line 3 -> 21 = 2 and line 2 -> 22 = 4.
FIG 3 -> 110 = 22 + 21 = 4 + 2 = 6
FIG 4 -> 101 = 22 + 20 = 4 + 1 = 5
The circular, target style, bar code illustrated in the patent application shows how Woodlands and Silver were concerned about how the code would needed to be read from any direction.
Classifying or Labelling?
It is strange that the system is described as a classification system rather than a labelling or coding system. This might best be illustrated by imaginging using the system to label two dissimilar items with the same code, or alternatively labelling two similar items with different codes. Classification is to do with identifying similarity and difference and labelling to do with marking or coding that similarity or difference.
In 1962 Woodlands and Silver sold their patents rights to Philco who sold the rights onto RCA and Woodlands went to work for IBM where he hoped to promote the idea.
KarTrak System
The railroad industry had a pressing need to track freight wagons. The KarTrak system developed by David J. Collins and the Sylvania Corporation used 2 part bands, each part of which was orange, blue or checkerboard, to represent the numbers 0 to 10 which were identified by shining coloured light onto the bands using a trackside reader. Collins wanted to produce a black and white version but was balked and left Sylvania to found Computer Identics Corporation.

The KarTrak two bar coding system; the parity bit is either 10 as shown or 0.
Readers
These early systems all suffered from the difficulty of producing efficient, compact and cost effective readers. Woodland and Silver’s first reader used a 500w incandescent bulb and a photo-multiplier tube, designed for movie sound systems. It was the size of a desk and needed to be shaded from ambient light. The expensive computers needed for the KarTrak system eventually saw its discontinuation after a successful initial introduction.
Eventual Success
RCA continued the development of the target shaped system for retail use and the crowds it attracted at a trade fair, running a competition, rekindled IBM’s interest; who then realised that Woodland was one of their employees. But the advent of cheap lasers and computers would be necessary for the triumph of the now ubiquitous barcode; with many different applications being championed by David J. Collins.
Architectural “Applications”
Bar coding eventually seeped through to architecture in sometimes charming ways.

Bar code building by Jan Timm.
QR Codes
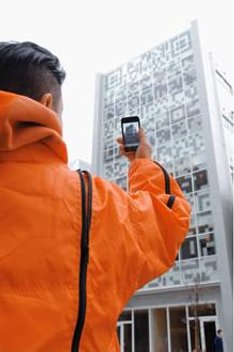
The cherry on the cake was the ability of smart phones to act as readers with orientation being ensured by 3 large corner symbols (4.1 below) with a deliberately smaller 4th corner symbol (4.2 below)

The N building in Tokyo, Japan is an apparently Augmented Reality project by Terradesign and Qosomo. Passersby can point their mobile devices at the building and find out what is going on inside. The building frame supplies the necessary quiet zone (5. above)