
I have recently become interested in visual thinking, probably because I like making arguments visually but also as a result of having encountered problems in producing simple easy to understand diagrams.
Diagrammatic Illustrations
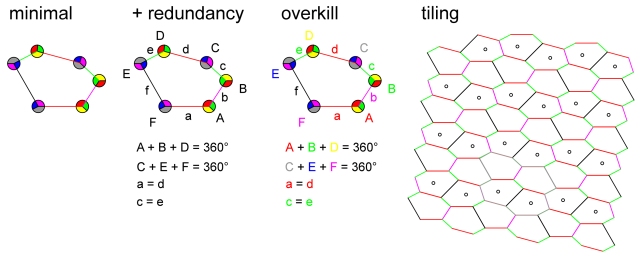 The minimal (graphics only) version above contains all the information required to define the tiling on the right (plus the information that reflexion is allowed).
Adding some redundancy to the diagram does aid its readability.
That is labelling the vertices (A to F), the edges (a to f) and listing the necessary relations between them (A+B+D = 360°, C+E+F = 360°, a = d and c = e).
Attempting to reinforce the relationships by colour coding the vertices, edges and their labels against each other does not aid readability, it just adds unnecessary visual noise.
The style and aspiration of these diagrams owes something to Oliver Byrne’s 1847
“The First Six Books of THE ELEMENTS OF EUCLID in which Coloured Diagrams and Symbols Are Used Instead of Letters for the Greater Ease of Learners”.

Visual Mathematics
As Marjorie Senechal says in Quasicrystals and Geometry (Senechal 1996) the discovery of quasicrystals has encouraged mathematicians to think visually again. In this respect she also somewhat surprisingly gives credit to Martin Jay’s Downcast Eyes: The Denigration Of Vision In Twentieth-Century French Thought, (Jay 1994).
Here is an example of Xavier Gérard Viennot demonstrating how to do some serious maths visually.
Prejudice Against Diagrams
On the other hand Sun-Joo Shin in the Logical Status of Diagrams (Shin 1994) is concerned that in mathematics, diagrams are not accepted as proofs and that there is a prejudice amongst mathematicians in favour of symbolic manipulation and other linguistic representations.
She suggests that the main obstacle to using diagrams as proofs is their long standing perceived tendency to mislead us in reasoning. For instance if you want to prove something about triangles and accidentally draw an isosceles triangle you might inadvertently use the specific properties of an isosceles triangle in arriving at your proof.
Alternatively a diagram might mislead one into denying a proposition that is true.
 If in the figure AB = AD and BC = CD then angle AEB is a right angle. But angle AEB does not look like a right angle so one might erroneously conclude that the proposition is false, rather than that the diagram is wrong.
But as Shin says (Shin 1994) quoting Barwise and Etchemendy
“If we threw out every form of reasoning that could be misapplied by the careless we would have very little left. Mathematical induction for example for example would go”
A Very Short History of Logic Diagrams
Using circles (or closed curves) to represent the classical syllogisms seems to go back at least as far as Ramon Lull (approximately 1232-1315). However it seems that Leonhard Euler, in the eighteenth century, was the first to use circles to represent relations between classes (what are now called sets). His method was improved in the nineteenth century by John Venn and in the twentieth by Charles Peirce and later by A. W. F. Edwards.
Euler Diagrams
Euler introduced his circles in Lettres à une princess d’ Allemagne (1761) to illustrate syllogistic reasoning. The four types of categorical sentences are represented as follows:-
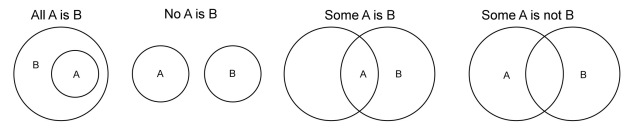
The two universal statements “All A is B” and “No A is B” are represented in an intuitive manner, following the convention that “A” and “B” refer to whole disks.
However there is scope for ambiguity with the existential statements “Some A is B” and “Some A is not B” and interpretation depends on the exact positioning of the labels.
Another problem with Euler Diagrams is that the system does not exhaust all the possible relations between two terms.
A final problem is that the proposition and result are represented in the same diagram so there is no opportunity to start with one proposition and then add another.
However as Martin Gardner points out (Gardner 1982)
“Here [in Euler’s Lettres à une princess d’ Allemagne] for the first time we meet with a geometrical system that will not only represent class statements and syllogisms in a highly isomorphic manner, but can be manipulated for the actual solution of problems in class logic”
Venn Diagrams
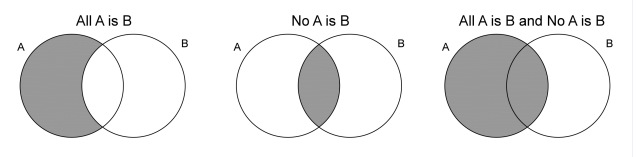
Venn Diagrams overcome most of the problems with Euler Diagrams by having a primary diagram that, influenced by Boolean algebra, labels each compartment in the following way and represents all the possible combinations of class A and class B as follows:-

Unlike in the Euler system, the overlap of the two circles does not represent any specific relation between the two classes. This is added by a separate syntactic device, shading, which is placed in an appropriate compartment.
As Venn expressed it:-
“What we do then is to ascertain what combinations of classes are negatived by any given proposition, and proceed to put some kind of mark against these in the diagram. For this purpose the most effective means is just to shade them out.”
For example the proposition “All A is B” implies that there is nothing in class “A and not B” so this region is shaded:-

Whilst not quite as intuitive as the Euler system this has the advantage that propositions can be combined as required.
 Again Venn puts it succinctly
“How widely different this plan is from the old-fashioned Eulerian diagrams will readily be seen. One great advantage consists in the ready way in which it lends itself to the representation of successive increments of knowledge as one proposition after another is taken into account, instead of demanding that we should endeavour to represent the net result of them all at one stroke.”
Venn-Peirce Diagrams
In 1896 Charles S. Peirce invented a system of logical diagrams that he called “Existential Graphs”. Peirce based his system on an examination of what he saw as the four faults of the Venn system (although he continued to call them Euler diagrams).
1. The Venn system “cannot affirm the existence of any description of an object”. As seen earlier Venn’s shading is only capable of representing universal statements.
2. The system “affords no means of expressing a knowledge that one or another of several alternative statements of things occurs.” That is the system is unable to express disjuctive information.
3. “It cannot express enumeration, statistical facts, measurements, or probabilities”. According to Shin, this is no worse than any standard first-order language with existential and universal quantifiers.
4. “It does not extend to the logic of relatives”. That is relations cannot be represented in this system.
In order to represent existential objects, Peirce introduces the character “x” into the system
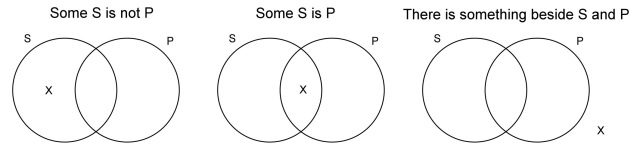
In order to represent disjunctive information, Peirce does two things. First he replaces Venn’s shading with the letter “o”. He then he suggests the following “rule”. “Connected assertions are made alternately” and introduces a syntactic device to represent disjunction. This is a line that joins “x” or “o” marks.

The right most diagram above conveys the information that is a disjunction of the information that the leftmost diagram conveys and the information that the middle one conveys.

In more complicated cases things are not so simple, in the example above the rightmost diagram conveys the disjunction of the information the two left hand diagrams represent. The effect is to undermine the visual simplicity of the original Venn system.

Peirce suggests a way around this by drawing a Venn diagram of Venn diagrams each surrounded by a circle to represent its Universe of Hypothesis, as above. There is then no need of connecting lines in the enclosing diagrams.
According to Shin this is very similar to the idea behind the disjunctive normal form of symbolic logic.
Peirce then introduces a set of 6 transformation rules for diagrams.
“‘Rule’ is here used in the sense in which we speak of the ‘rules’ of algebra; that is as a permission under strictly defined conditions”
Rule 1: We may erase any entire sign (“o”, “x” or a connected body) Rule 2: We may connect a character to any other character Rule 3: Any assertion which could permissively be written, if there were no other assertion, can be written at any time, detachedly. I think this means that we can put in a new piece of information. Rule 4: When more than one character is written in the same compartment we may transform a diagram in several different ways (i) Characters in the same compartment of the same kind or sign, whether attached or detached are equivalent to one writing of it. (ii) Characters of two different signs (ii-1) Connected signs may be erased since equivalent to no sign at all. (ii-2) Detached signs indicate an absurdity. (iii) Different kinds of signs connected with other signs say, P and Q. Then we may erase the two contrary signs and connect P and Q. Rule 5: We may erase a circle. Rule 6: We may draw a circle.Here we are a long way from intuitive visual diagrams and Peirce was aware of the shortcomings of his rules.
“These six rules have been written down entirely without preconsideration; and it is probably that they might be simplified and not unlikely that some have been overlooked”
Shin identifies Peirce’s mixing of syntactic and semantic information in rules 1 and 2 as a problem and goes on to develop systems that she calls Venn-I and Venn-II. Neither of these is visually any simpler than Venn-Peirce diagrams.
In quick summary Venn-I uses shading for emptiness, ‘x’ for existential input and connecting lines between ‘x’s for disjoint information. Venn-II is as Venn-I plus connecting lines between diagrams for disjunctive information.
Lambert Diagrams

Lambert published his system in 1764 apparently unaware of Euler’s work. His innovation was to use dotted lines and accurate positioning of labels for the existential statements “Some A is B” and “Some A is not B”.
Lambert represents an individual as a dot and the position of the letter “A” is important. Thus there is at least one thing that is “A” and that thing is represented where the letter “A” is written.
Dotted lines represent uncertainty in the following sense: something else that is “A” might exist, and if it does it can be represented by one of the dots.
Peirce was critical of Lambert for wrongly believing that a sentence or a diagram represents a way of thinking about a fact, not the fact itself.
Lewis Carroll Diagrams
Charles Dodgson (Lewis Carroll) was a contemporary of Venn’s and taught mathematics at Christ Church Oxford. He thought that the universal set should be represented not by the whole plane as in Venn’s diagram but by a closed area and that rectangles rather than circles should be used.
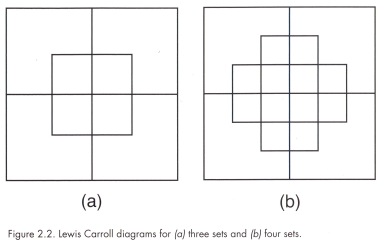
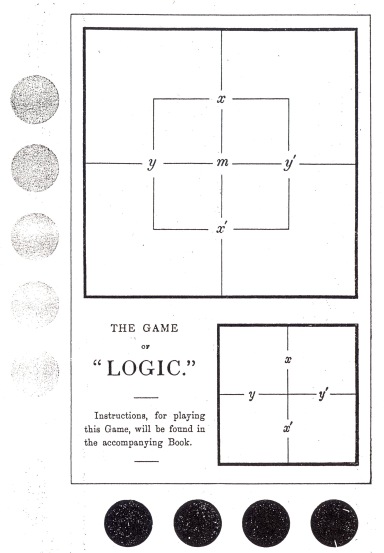
Dodgson used his three set diagram for his Game of Logic, which first appeared in 1887.
But according to A.W.F. Edwards (Edwards 2004) both Venn and Dodgson lost their nerve when it came to diagrams for 5 sets and produced diagrams with disjoint sets.
Edwards-Venn Diagrams


Venn diagrams for 4 and 5 sets redrawn from Venn
As noted above Venn and Carroll Diagrams work well with 2, 3 or even 4 sets but become increasingly difficult to construct for higher numbers.

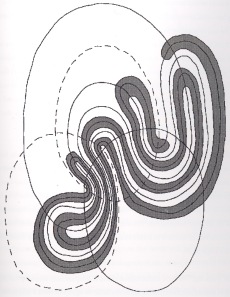
Edward’s first intuition followed a piece of work on knots by Tait (Tait 1876). If you draw an endless line on a piece of paper so that it cuts itself any number of times (but never cuts itself more than once at the same point), then you can colour the resulting regions using only two colours without any adjoining regions being the same colour, as in the diagram above.
Venn diagrams also possess this property which can be nicely demonstrated by induction.
“Suppose the property holds for a diagram with n sets. Then the closed curve for the set next added, the (n + 1)th, has to pass through each of the 2n regions of the existing diagram. In the new diagram there will be 2n regions inside the new set and 2n outside. Change the colour of each of those inside the new set and the property now holds for a diagram with n + 1 sets, because all the regions which have been divided by the new curve are differently coloured. But it certainly holds for a one-set diagram, so it must hold for any number of sets”.
This is Edward’s redrawing, and correcting, of Peirce’s diagram labelled
“This shows that n closed curves can be drawn so as to separate the plane into just 2n regions no more no less”
Edward’s next insight was to realise that the problem of higher numbers of sets was simplified if one drew the regions onto a sphere and then projected the result onto the plane.

The method can produce both Venn and Carroll forms of diagram depending upon the orientation of the sphere.

 Venn diagram for 9 sets
Once a method was found a minor flood of alternative constructions appeared.
 Adelaide is a 7 set symmetric Venn Diagram that A.W.F. Edwards discovered in Adelaide, and was independently discovered by Branko Grünbaum. There are also Hamilton, Massey, Victoria, Palmerston North and Manawatü, all of which are 7 set symmetrical diagrams constructed on a necklace principle and named for the places they were found.
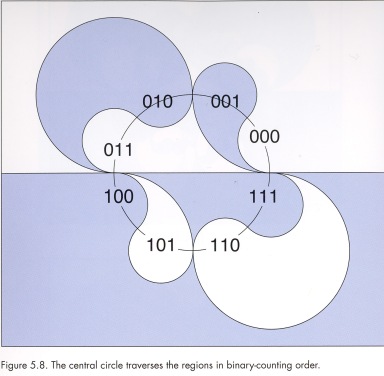
The two colour nature of Venn diagrams means they can even be used to generate binary sequences as above.

With the same spirit I have given an description (or visualization of the proof) of the four color theorem without using a computer at
https://www.academia.edu/440527/VISUALIZATION_OF_THE_FOUR_COLOR_THEOREM
LikeLike
Hi Ibrahim, thanks for seeking this out, and adding your reference. Re-reading my post I realise that it has a lot of detail, but then rather runs out of steam.
LikeLike
I just thought I’d mention the follwoing books by Rudolf Arnheim;
“Visual Thinking” 1969, University of California Press
“Entropy and Art” 1971, University of California Press
LikeLike
I’m sure I have “Visual Thinking” but not “Entropy and Art”
which I will get hold of
Thanks
LikeLike
The binary descriptions look useful for building door lock key suiting.
LikeLike
They can generate or are equivalent to binary Gray codes that are used for all sorts of purposes like switches and door locks.
LikeLike